
ASMR of England's All-Cause Deaths by Vaccination Status
Analysis reveals missing data, and likely lower or similar mortality in COVID-19 unvaccinated.

Summary
All-cause ASMR by vaccination status appears to be similar in 2021, but lower in 2022 for the unvaccinated.
Almost 37 thousand deaths are missing in the dataset for 2022, which makes the dataset unreliable.
No significant vaccine efficacy can be seen from the all-cause mortality data, despite ongoing excess deaths.
In my opinion, it is still most likely that there’s no significant difference between the two groups. And the claimed vaccine effect is entirely a statistical illusion.
Background
In my previous three posts, I have already analyzed the English ONS All-Cause Mortality data by vaccination status. The main ONS headline chart produced from this dataset uses questionable age-adjusted mortality rate (ASMR) calculations that are based on person-years (PY). It shows that the ASMR/PY of the unvaccinated is consistently higher than those of the vaccinated. Now, that method has several issues as kindly outlined by Mahmudur Rahman, PhD on Twitter. ONS themselves acknowledge that this data may not be used to assess vaccine efficacy.

Tables 1-4 of the ONS dataset list these rates. In addition, table 5 provides data by “Ever vaccinated” and “Unvaccinated”. In this article, I have analyzed the data from table 5.
Population by Vaccination status
The numerator for the mortality rate calculation is provided in the ONS dataset. However, the denominator, i.e. the population by vaccination status, is not provided. Here, we have to use the “vaccine register dataset”, which lists vaccinated population by day and age group. Since this dataset provides both, absolute and relative figures, we can therefore calculate the total population (and number of unvaccinated people).
One caveat is, that since table 5, only lists monthly aggregated deaths, we cannot calculate daily or weekly rates. Therefore, to aggregate the population by vaccination status on a monthly basis, I use the mean, minimum and maximum of vaccinated and unvaccinated people, in order to calculate the lower and upper bound of the mortality rate.
Crude Mortality Rate by Vaccination Status
Now we can calculate the crude mortality rate, which is deaths divided by population. Here we can see that the crude mortality rate for all the vaccinated cohort is much higher than for the unvaccinated. Now, that is because the share of vaccinated is much higher in the older age groups (Simpsons paradox).

Therefore, we must look at the individual age groups or age-adjust to produce a single figure. Here’s the crude mortality rate for each age group:
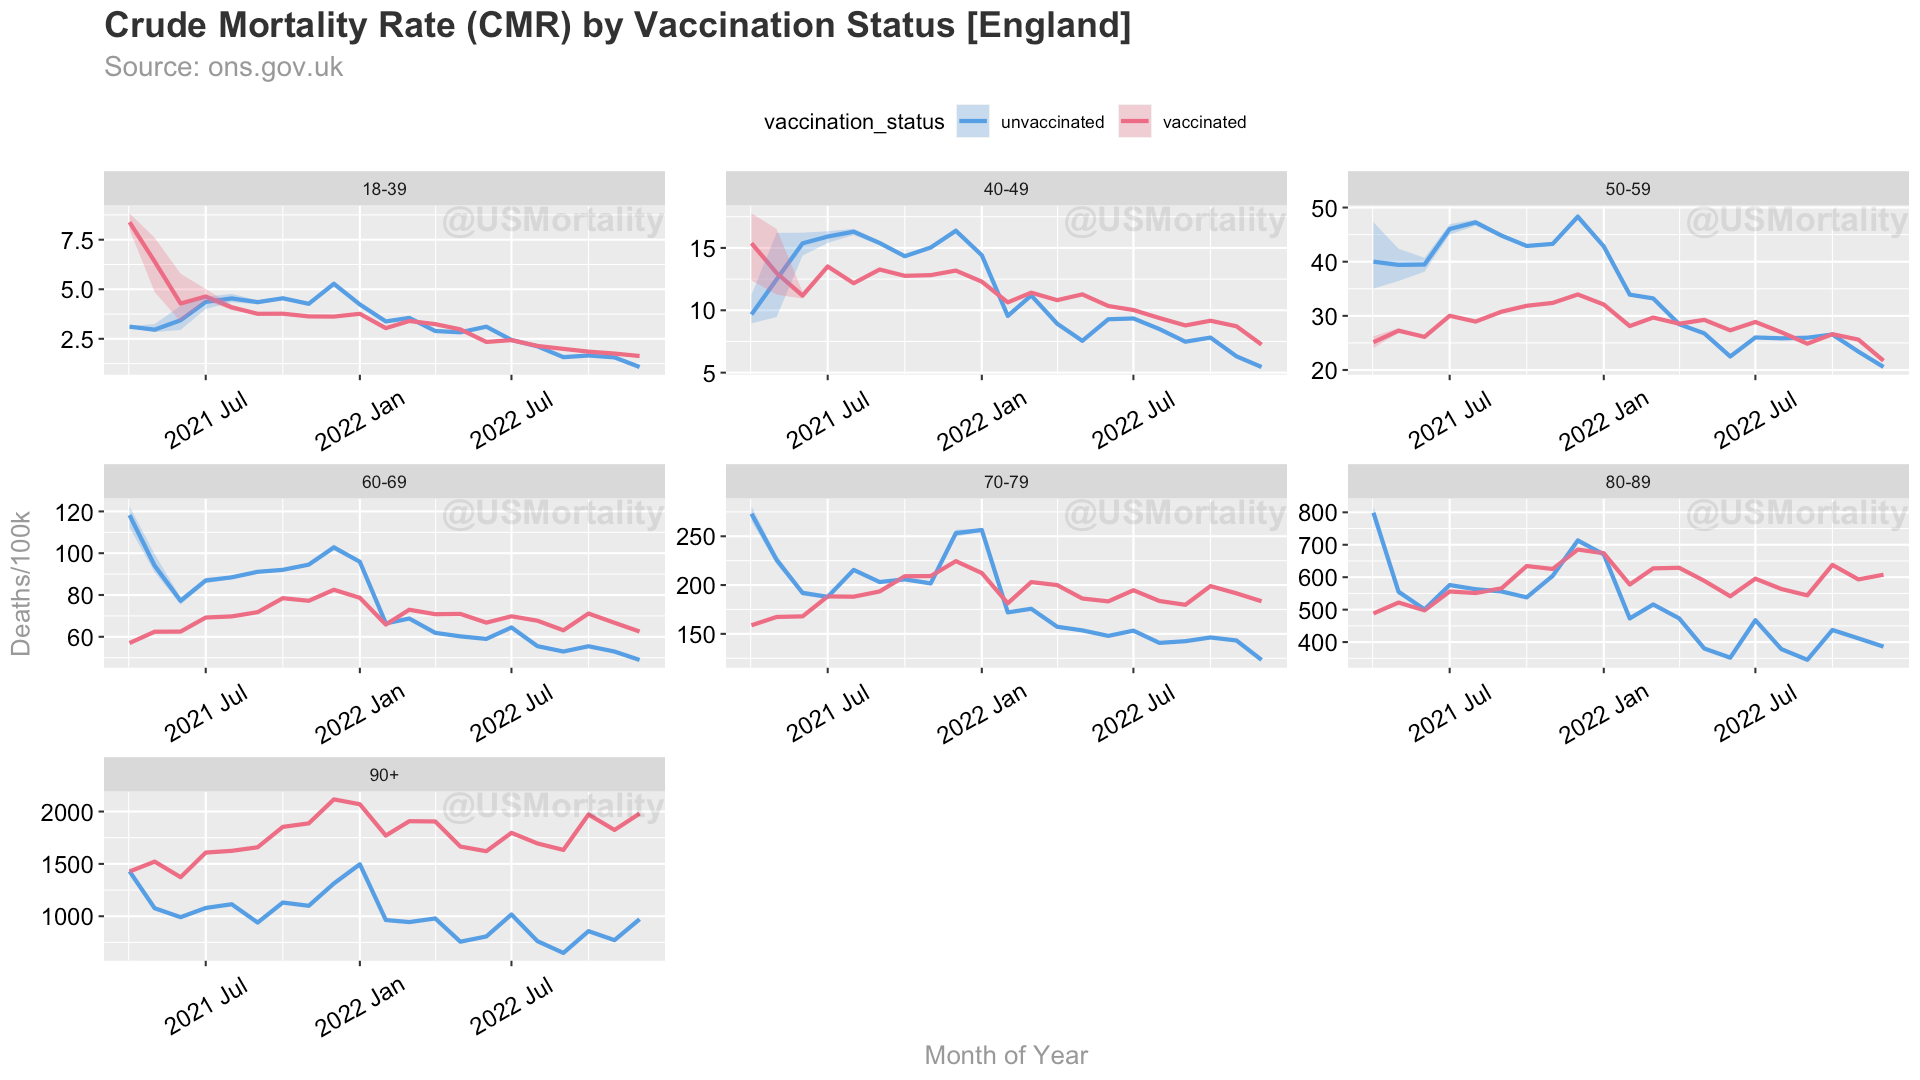
The main takeaways from this chart are:
There seems to be no significantly visible difference, besides some rather random fluctuations, which might be due to the classification and other methodological issues, as described before.
There is definitely no difference in the <40-year-olds.
In the middle age groups, in 2021 the unvaccinated rate appears to be somewhat higher, while in 2022 it shows the opposite.
Age-Standardize Mortality
To produce a single blended chart, I have age-standardized the above figures using the European Standard Population 2013. To account for the population moving from unvaccinated to vaccinated, I have included the max/min lower and upper bounds of the rates, but they do not appear to make a significant difference, which begs the question of why ONS has chosen to rely on person year calculation after all.

So once we properly age-adjust, the data becomes much more clear.
The main takeaways here are:
In April and May, unvaccinated mortality rate is still higher, which is likely due to reporting delay, of the then ongoing vaccination campaign, as pointed out by Fenton et al.
June to December 2021 the rates are very similar.
Starting in January 2022, there’s a sudden drop of the unvaccinated rates, which then steadily remain lower for the whole year. This likely points to another data anomaly, which I will further prove next.
Data issues
As many have pointed out, there have been many issues with the dataset. To possibly explain the drop in the unvaccinated rate in 2022, I have used the ONS weekly deaths dataset to produce monthly deaths and compare them to table 5.

And indeed, while in 2021 the totals of the two dataset matches, in 2022 the vaccination status dataset (table 5) contains significantly fewer deaths than what is reported in the weekly dataset. Unfortunately, the weekly dataset does not provide age-stratified data for England only, which is why we cannot investigate the issue further.
The difference by year is:
2021: 65 (negligible)
2022: -36,799 (!!)
So there are about 6.8% missing deaths for 2022 (36,799/541,050) in the vaccination status dataset. This should be immediately addressed by ONS.
Data & Calculations
Data & Calculations can be found here: https://github.com/USMortality/charts/tree/uk/covid19/gbr
Please let me know what you think in the comments!
Great analyses Ben, and thanks especially for the github repo. Wanted to mention a likely *second* Simpsons paradox situation for the "Ever vaccinated" aggregate curve. To see this, take Table 1 and plot the mortality rate curves for each of the vaccinated subgroups. Interestingly, they all quickly shoot well above the unvaccinated curve and remain there. So it appears the valleys of these subgroup curves cancel out peaks when computing the aggregated curve, and we should account for people moving from one vax subgroup to the next. As you have shown, typically in Simpson's paradox cases, it is the subgroup (stratified) curves that tell the real story.
Would speculate that if we do two-way stratification and adjustment on vax subgroup and age, then the results would clearly favor unvaccinated.
You could try this dataset to see what deaths are missing by age up to July 2022?
https://www.ons.gov.uk/peoplepopulationandcommunity/birthsdeathsandmarriages/deaths/adhocs/15018dailydeathsbydateofoccurrence1june2014to31july2022bysingleyearofageandsexengland