US Mortality Update 35/2022
Weekly All-Cause Mortality Update for the United States
Welcome to my new series about US all-cause mortality.
The latest wave of excess appears to come to an end. Excess mortality peaked with a sigma 17.1 (z-score) in week 25 and has been declining since then, coming down to around 7.1 currently. Noteworthy, that this is lower than the summer wave of 2020 but higher than the 2021 summer levels. It remains to be seen if another wave is about to start.
Let’s look at excess mortality by age group.
We can see that <25 years has been back to normal range since week 23. Still slightly elevated though… But better than last year this time.
While the middle age groups dipped back to normal in spring/early summer, it appears they are creeping back up slightly above the ‘substantial increase’ treshold now (4x stddv).
Most interesting is that seniors are back into heavy excess territory with sigmas of around 5-10.
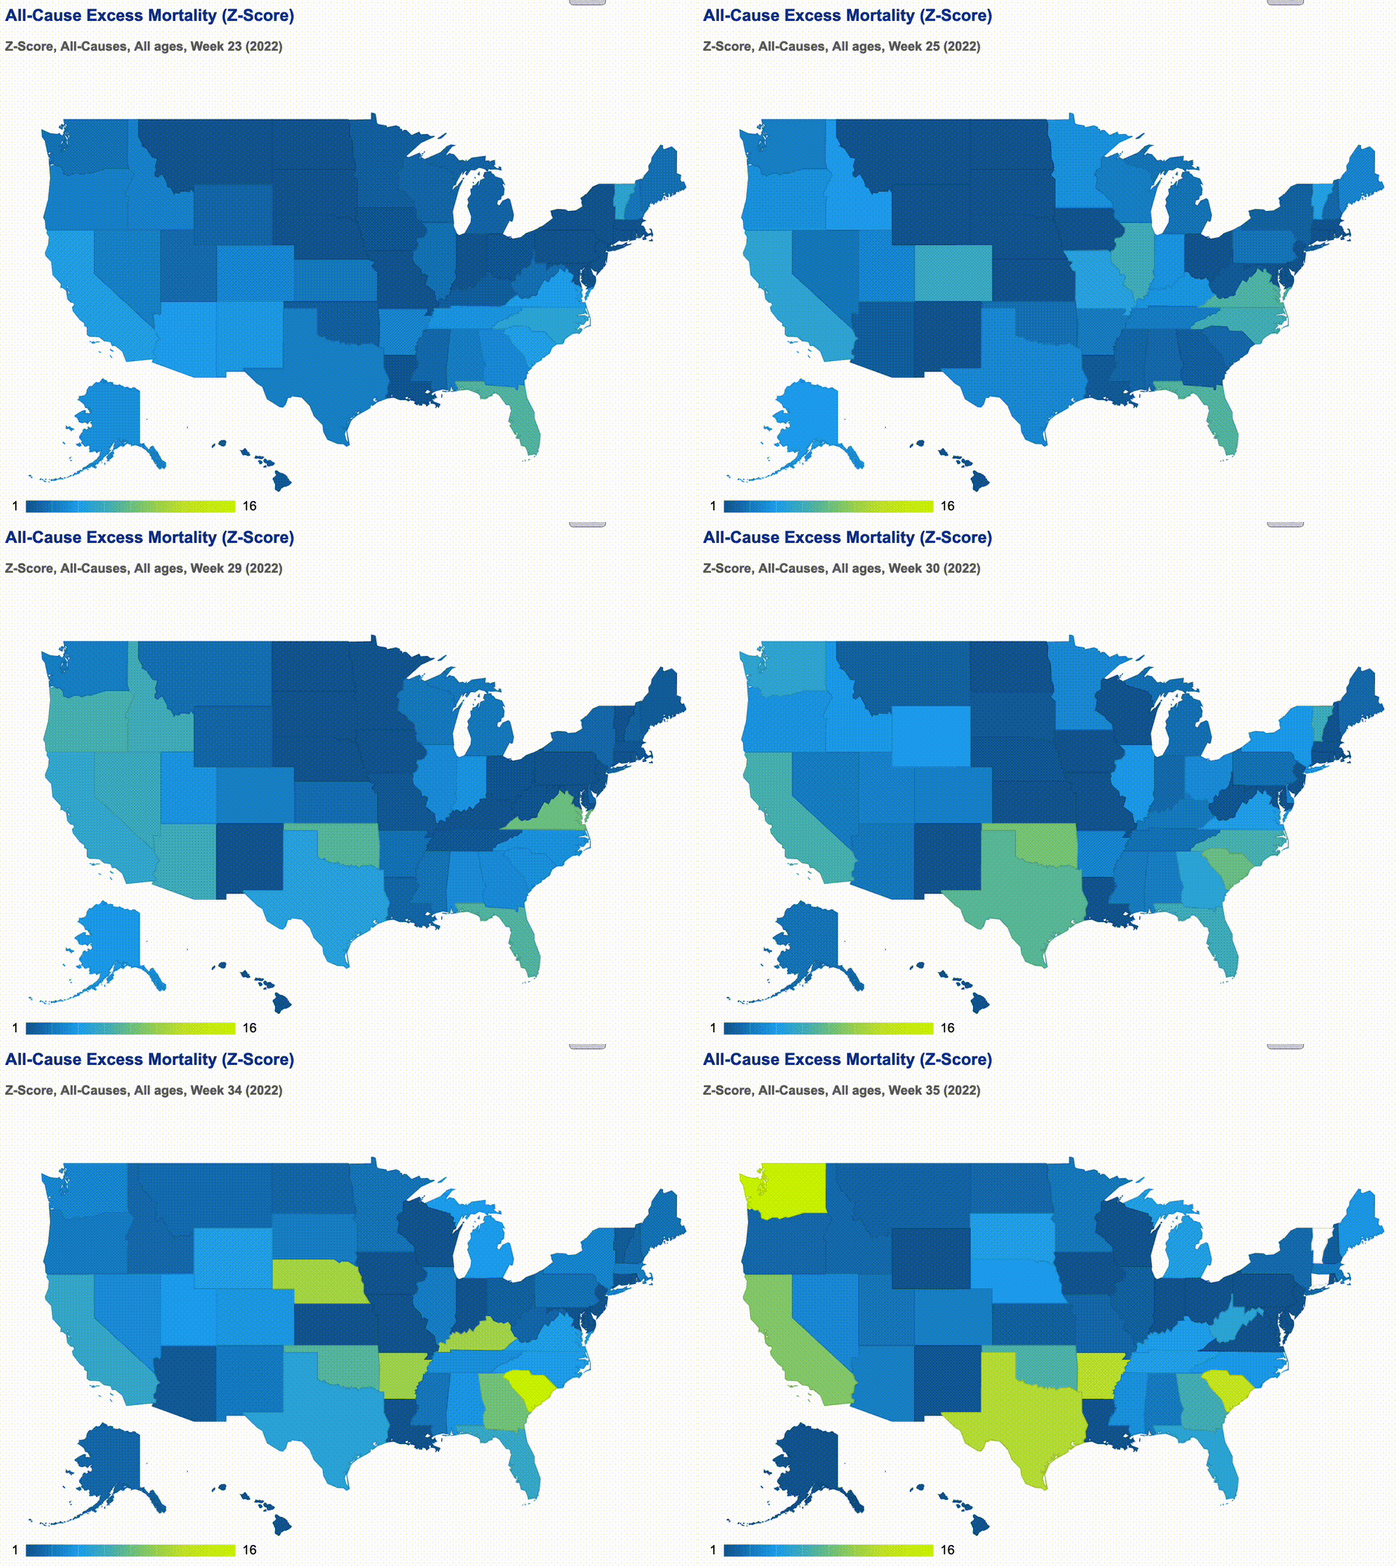
Here’s a looping map of the excess mortality by state of the last 3 months (13 weeks). We can see that excess is happening all over, but currently mostly in the South and West.
Here’s a map of cumulative excess mortality during the pandemic. No clear trend emerges.
Here’s the current “ranking” of states by excess mortality in percent. A rather linear trend emerges. I have not been able to spot any clear trends or correlations.
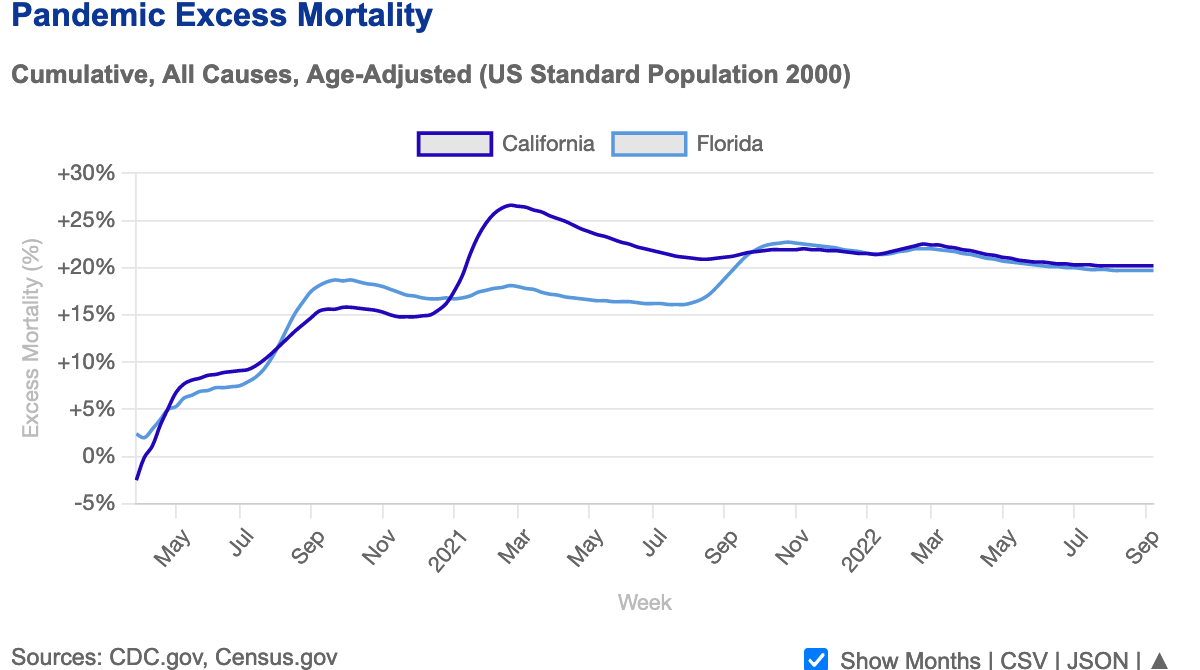
For example, compare California and Florida, both appear to have similar trajectories and end up almost at the same spot around +20% excess mortality while having completely different policies. Some argue, that most of the excess in CA happened before the vaccinations - while that might be true, the overall excess trajectory remains unchanged, which counters that narrative.
Cumulative Excess deaths are now at 1.120M.
Grouped by year we can see that cumulative Excess deaths now are lower than in the previous two years, but still significantly higher than expected.
United States reported 3,353,789 deaths, for the 52 weeks of year 2020 (all years of age). Expected deaths were 2,921,618. That is an increase of +432,171 deaths (+14.8%).
United States reported 3,457,544 deaths for the 52 weeks of year 2021 (all years of age). Expected deaths were 2,949,097. That is an increase of +508,447 deaths (+17.2%).
Year to date, United States reported 2,195,252 deaths for the 35 weeks of year 2022 (all years of age). Expected deaths were 2,004,556. That is an increase of +190,696 deaths (+9.5%).
Grouping by season as some might prefer, as it avoids cutting the winter wave in half, shows a similar picture. 2021/’22 slightly higher than 2020/’21.
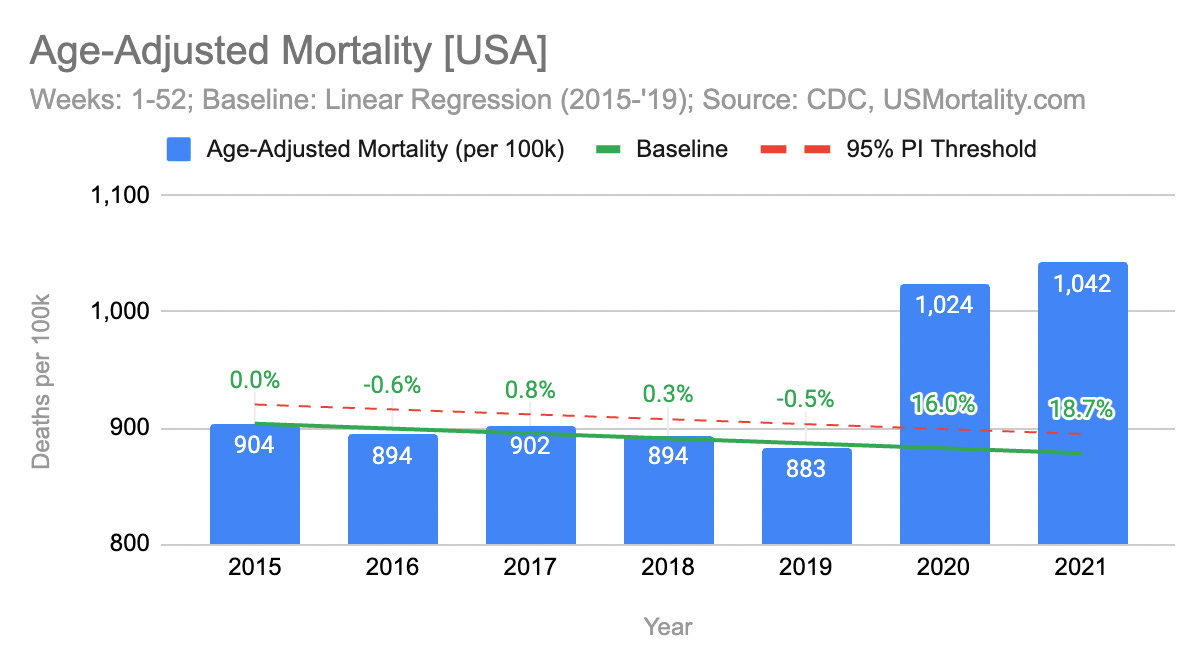
When looking at age-adjusted mortality (deaths/100k) vs the de-trended baseline we can see that Up to week 35 (YTD) mortality is still significantly higher than to be expected. While 2021 was almost +16%, both 2020 and 2022 come in around +12%.
For comparison here’s the full year.
Same chart without COVID-19 coded deaths - we can see that even without COVID-19 ICD-10 coded deaths (I am aware of the issues (!!)) - excess is significantly above normal.
As can be seen from the following chart, “waves“ rarely align seasonally. That means we will have to wait a couple of months, to see if this was the last wave, of if more waves are to be expected.
In this chart we can see All-Cause Excess mortality, vaccinations and COVID-19 deaths. Excess mortality remained extraordinarily high during and after the initial vaccination, only to finally drop now to more moderate levels. However even these levels are still higher than last year.
Finally mortality grouped by quarter.
You can find all these charts on my website for free: www.usmortality.com
Please let me know any feedback.


Your chart of the states seems to be missing Connecticut- was this on purpose? I know firsthand they are monkeying around with their data, because I was in the system during this period.
Also, I have a theory about NYC and Arizona. Just spitballing here, but I live near the border with NYC and their state funded hospital system is crumbling under the pressure from Covid and it has never recovered- at bit like the NHS. Qualified employees have left that expensive area and they are struggling to find new ones to fill in the gaps. Could that account for the high deaths? I remember one video of one such hospital during covid that forced everyone on a vent and a whistleblower nurse filmed it all- they even put a young man on the vent and she begged them not to because it was a death sentence, but they did it anyway. He died days later.
And as for Arizona, could these death numbers include Mexicans who were transferred to AZ hospitals during covid waves? I remember them allowing that during various stages of the pandemic...
Welcome to substack!
I wonder if there is a correlation of excess mortality with percent of the elderly that are vaccinated, and if so, the # of shots they have had? I am a general internist, and I think my elderly patients are most positive about and also getting the most boosters. But we can't really assess dose-response well, can we? I really think of the vaxxes as being exposures to something toxic, the spike protein or LNP or both, and now we have folks with as many as 5 shots, and maybe an acute Covid bout in there too, which to me means potentially 6 exposures to a toxin. Just my thoughts as a physician.